Building at scale: How we moved from Serverless to Kubernetes (Part 1)


Our journey began with a reverse proxy service we used facilitate access to blockchain Nodes. Initially, we ran this service on Cloudflare Workers, a serverless platform that was handling over 5,000 requests per second globally. It worked well at first — but as usage grew, so did our concerns around observability, state management, and cost.
With traffic doubling monthly and Cloudflare billing us per request, we knew we had to act fast. More critically, we lacked visibility into how the service behaved across different chains. Managing state effectively was becoming essential to ensure reliability, and our tooling had reached its limit.
Leaving Serverless Behind
We made the call to move off Cloudflare Workers and into our own Kubernetes infrastructure. This gave us full control over performance, cost tuning, and observability — all of which were hard to manage in a serverless environment.
The next question we asked was: which language and framework should we use?
Node.js felt like a natural choice. It’s strong in I/O-heavy scenarios, and our existing Cloudflare codebase was written in TypeScript — giving us a fast path to MVP. The service itself was fairly straightforward: it handled authentication, rate limiting, analytics, and routing requests to healthy nodes using failover heuristics.
We went with a Node.js service using Hono (a lightweight web framework), and began building.
From Zero to Geo: Getting Production-Ready
After a few days of implementation and testing, we set up regional Kubernetes clusters, deployed our services, set up necessary caching and databases, and began shadowing traffic from Cloudflare using Geo routing to keep low latency globally.
Our smallest region handled the load well — so we scaled up testing in a larger region. That’s when things got interesting.
Preparing kubernetes clusters for high load
In our larger region, the cluster started to buckle:
- Network congestion emerged
- The database was overwhelmed
- Sporadic 502 errors popped up
These were textbook large-scale infra issues. One immediate bottleneck we noticed: requests needed to do DNS resolution to find a node — and DNS lookups were saturating the network.
We tuned our Traefik load balancer to handle higher throughput. Along the way, we learned that Go services create a connection pool for reuse, but at our scale this pool became a source of contention. We raised the --idle-connections limit aggressively — and later ended up disabling it entirely. This helped reduce 502s, but some latency remained, and HTTP 499s (client timeouts) were too high.
After quick debugging, we realized DNS resolution was still a pain point. So we installed NodeLocal DNS inside our Kubernetes cluster, which significantly improved resolution latency.
Database Pressure and Pod Surges
Another issue: our database was hitting the maximum connection limit. A a classic DB issue we noticed directly noticed during rolling deployments, were the pod count temporarily doubled.
The fix: we integrated PgBouncer, a lightweight connection pooler, to manage connections more efficiently.
After several days of load and functional testing, everything looked stable. We gradually routed 100% of traffic off Cloudflare and onto our new infrastructure.
False Calm
Things were stable. 502s still appeared, but at very low volume. We were shipping features fast and didn’t notice anything major — and celebrated a smooth migration.
But as our release pace slowed, we noticed a trend: 502 errors were climbing steadily. No infra changes. No new deployments. Just… more failures. Quick investigation found that we had the a memory leak in our system.
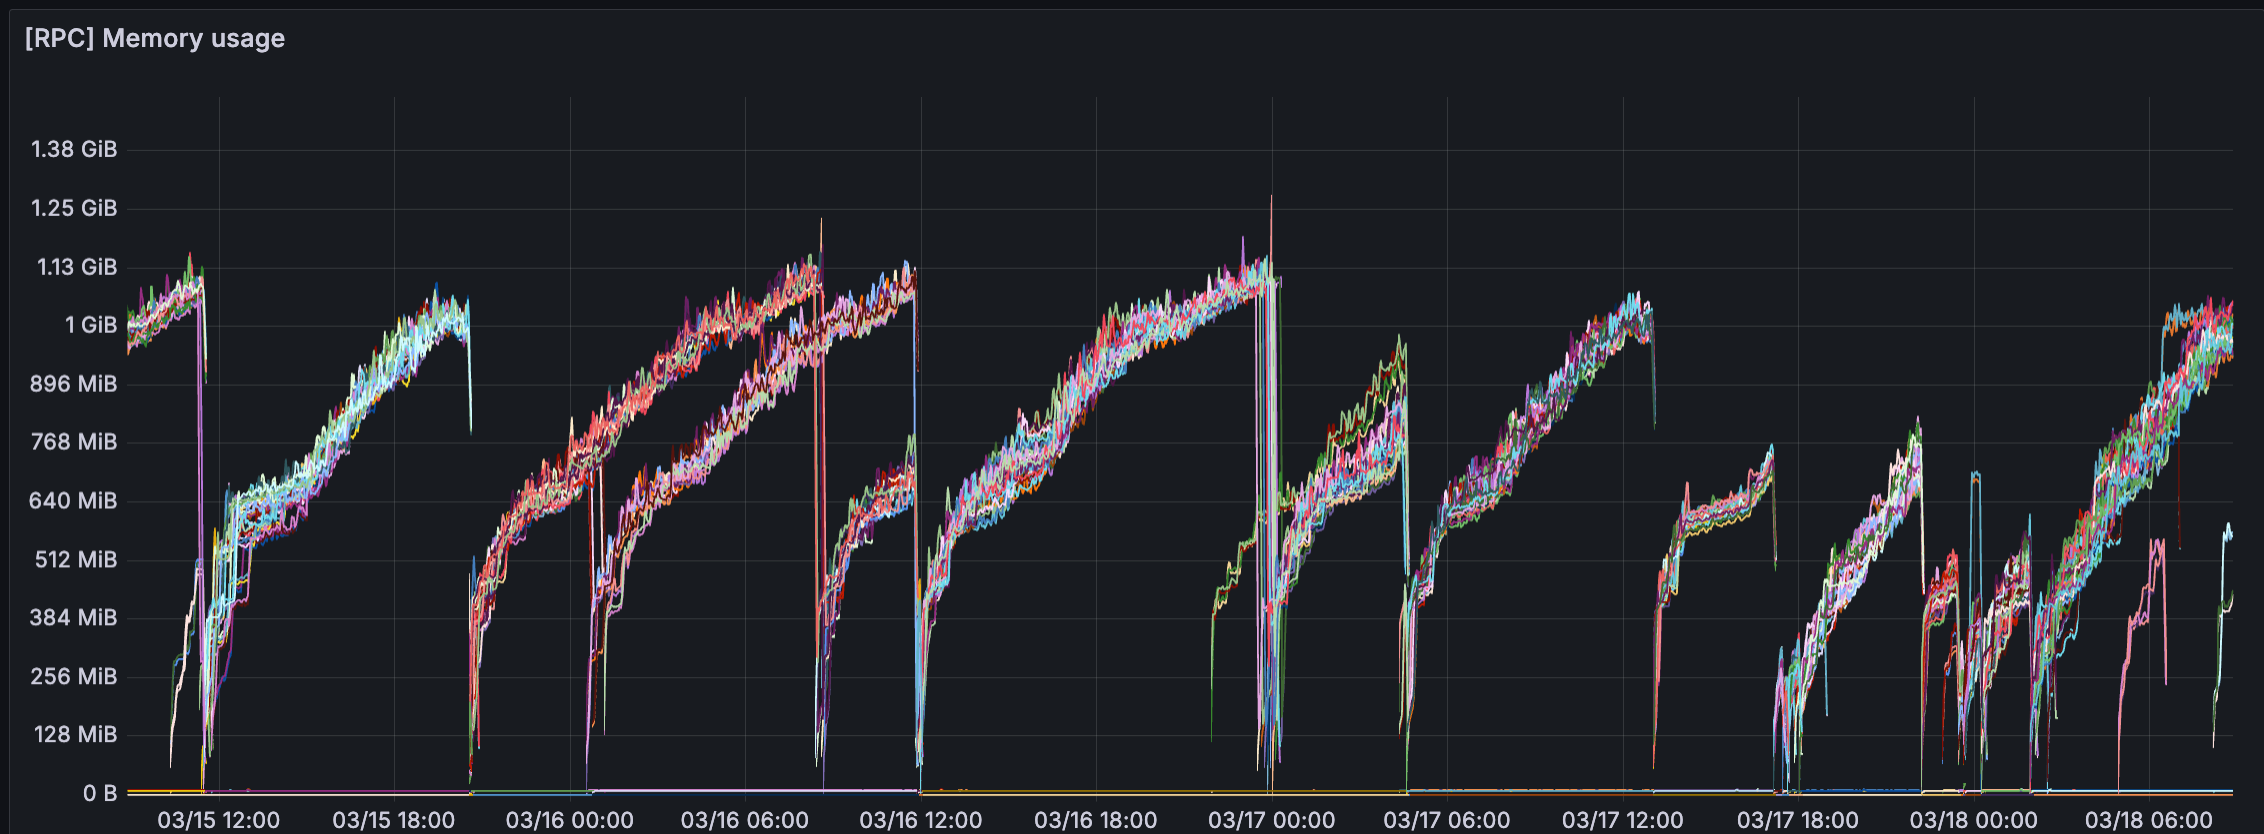
In Part 2, we’ll dive into the root cause analysis and how we traced, diagnosed, and fixed the memory leak — and what we learned about managing memory in high-scale Node.js services.