Introducing Engine Metrics

We are excited to announce a significant update designed to bring greater transparency and control to your managed engine instances. At the heart of this update is a suite of new features aimed at giving you deeper insights into the performance and health of your engine instances.
Detailed Load Monitoring
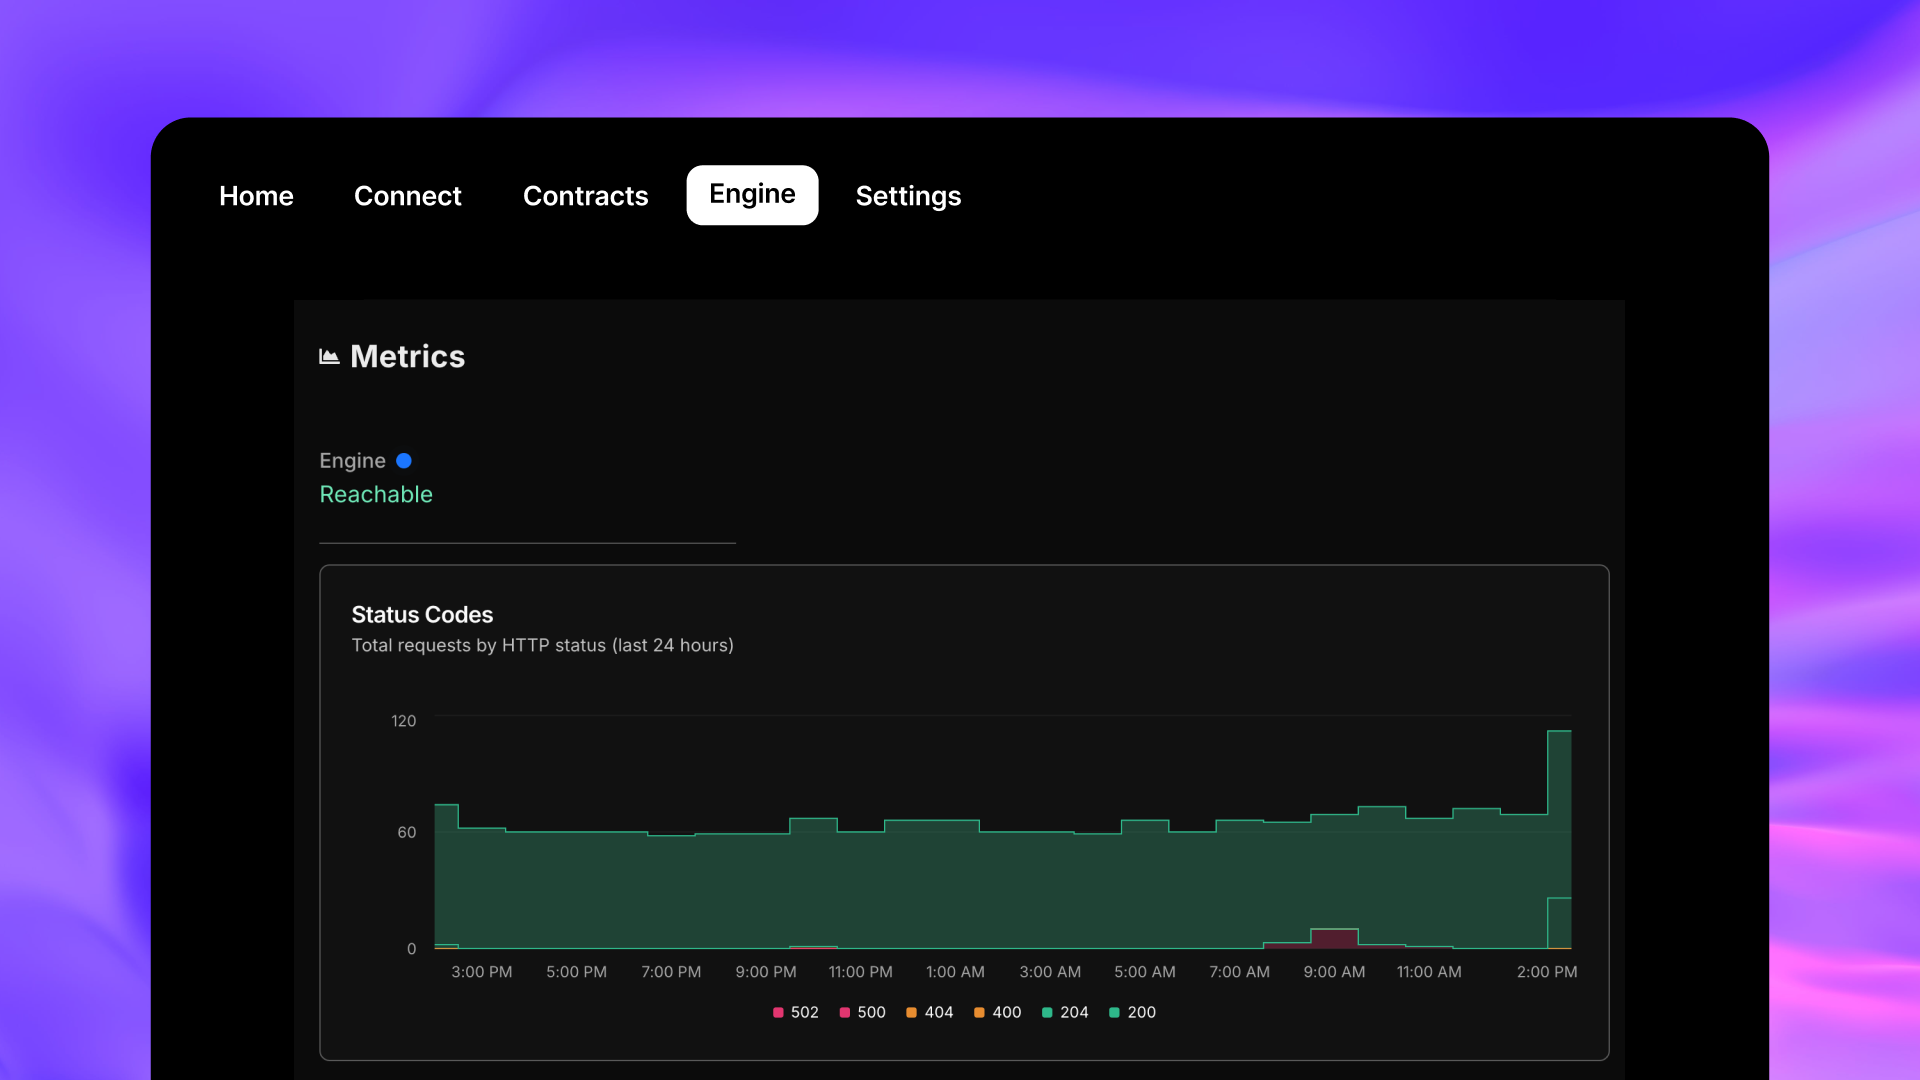
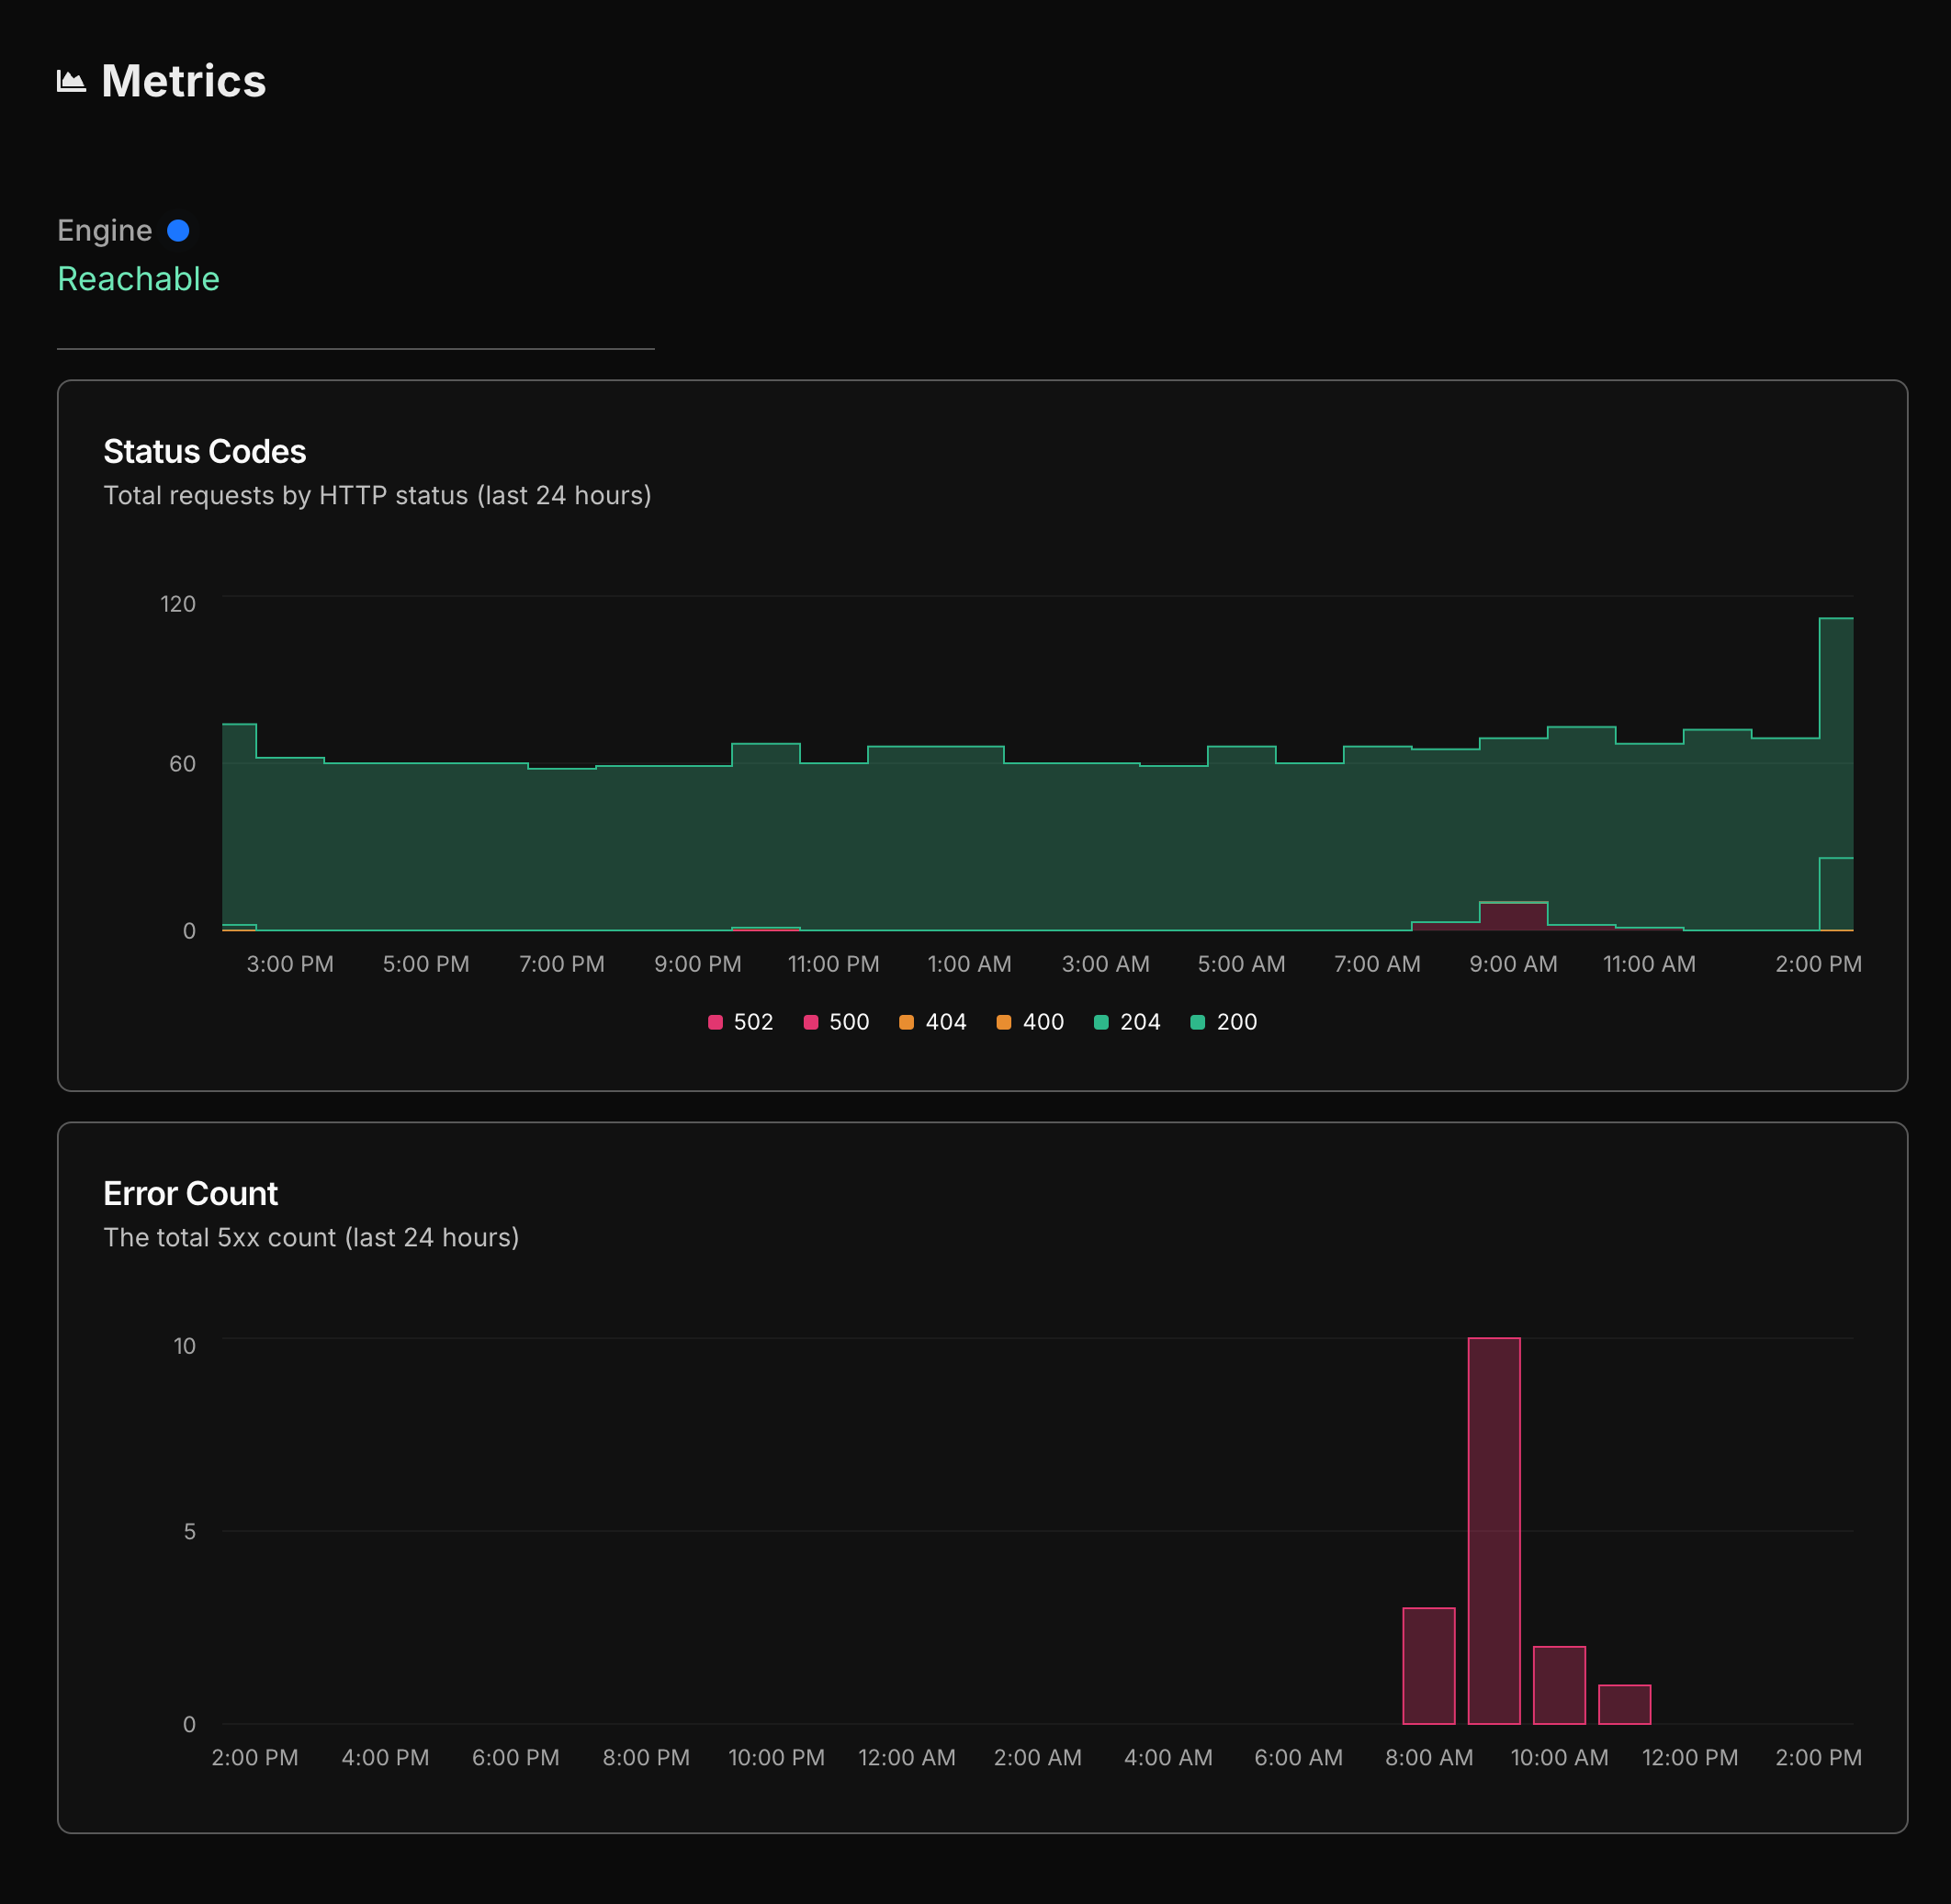
Starting today, you will be able to see the load on your engine instance broken down by status code. This granular view allows you to understand how your traffic is distributed across different types of responses. Whether it’s a successful request or an error, you can now pinpoint exactly where traffic spikes happen. This information is crucial for optimizing performance and ensuring that your services are running smoothly.
Error Rate Tracking
In addition to load monitoring, you can now track the error rate over time. This feature provides a historical view of how errors are occurring within your instance. By analyzing error trends, you can identify patterns and potential issues before they become critical. This proactive approach helps maintain a high level of service reliability and reduces downtime.
Health Check Insights
Finally, we’ve introduced a comprehensive health check feature. This tool gives you a real-time snapshot of your instance’s health. health checks help you stay informed about any potential problems and allow for timely interventions to keep your instances running at peak performance.
These new features are part of our ongoing commitment to providing you with the best tools and insights to manage your infrastructure effectively. We believe that transparency is key to operational excellence, and with these enhancements, you are better equipped to monitor, diagnose, and optimize your managed engine instances.
Explore these new features today and take control of your engine instances with clarity and confidence.